A Time Domain Reflectometry (TDR) Based Electric Fence Fault Detector
Background
Electric fences are used to create protected areas (PAs) to restrict the movement of wildlife. Most PAs cover very large tracts of land. For this reason, very long cables are needed to create perimeter fences around them. A case example is the Dedan Kimathi University of Technology Conservancy that covers an area of 509,904 m2 (126 acres) and has a 4.8 km long electric fence around it. Larger conservancies require electric fences that span hundreds of kilometres. Electric fences are prone to faults. Faults affect the effectiveness of the fences and hence they need to be detected, localised and corrected as soon as they occur.
Current methods of fault detection and localisation involve continuous monitoring of the fence. Once a fault is detected, personnel are needed to walk along the fence to locate the fault and correct it. This is a tedious and time consuming process given the long distances of cables used to make the electric fences.
Accomplishments
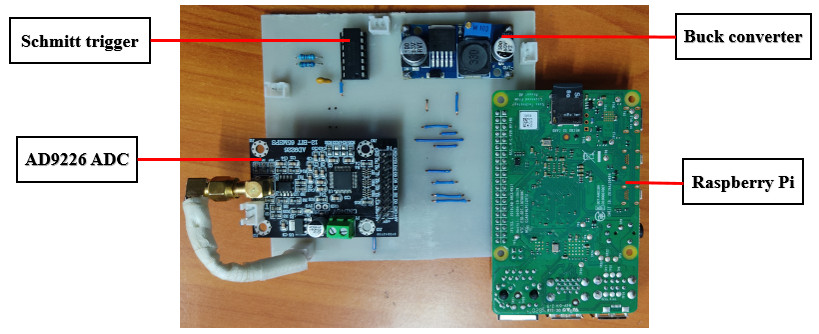
Time Domain Reflectometer Design
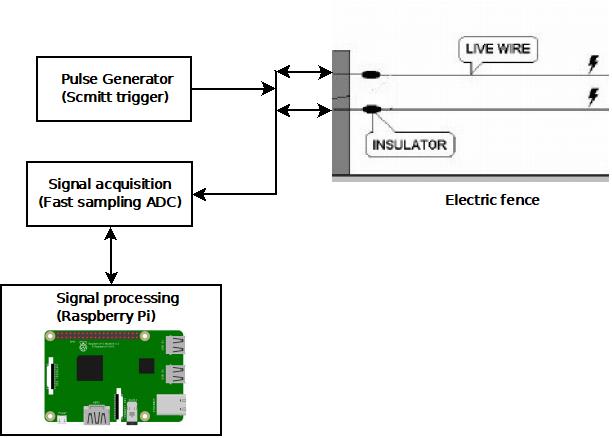
A Raspberry Pi based time domain reflectometer has been developed. The TDR system has an onboard Schmitt trigger that generates pulses to be fed to the cable under test (CUT). Programs to acquire the signal samples and process them have been developed and loaded onto the Raspberry Pi.
Data Collection
Dedan Kimathi Data Collection
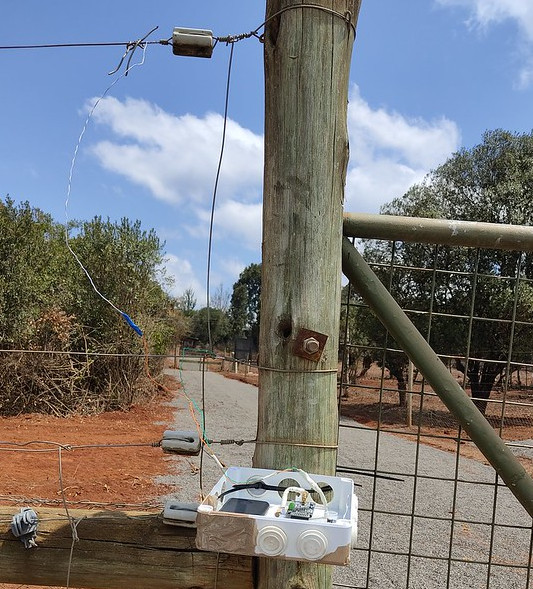
The TDR system has been used to collect data using an electric fence at the Dedan Kimathi University of Technology Conservancy. Short circuit faults were simulated at different points of a section of the fence (about 110 m long) and then the TDR system was used to send pulses down the fence, sample them at the input and then save them for processing. The pulses used have an amplitude of 5 V and a frequency of 8.3 kHz and they are sampled at 31 MSPS.
Olpejeta Conservancy Data Collection
Two data collection exercises were conducted at Ol Pejeta Conservancy. During the first exercise, experiments were conducted using a 280 m long section of an electric fence at the conservancy. Ten short circuit and one open circuit faults were simulated and data was collected. The second data collection exercise involved conducting experiments with a 958 m long section of an electric fence. Open circuit and short circuit faults were simulated with the fence.


Data Analysis
Analysis has been done on the data collected during the data collection exercise to develop a TDR algorithm. Use this link to see the analysis done on the data.
System Architecture
Next Steps
- Explore how to interface the Raspberry Pi TDR with a live fence
- Develop a state of the art Raspberry Pi TDR