Water Resource Monitoring
Background
Often surrounded by high ground, a catchment is an area of land where water collects when it rains. Catchments can greatly vary in size from small sub-catchments (200 square kilometers or less) to large catchments (1000 square kilometers or more). The virgin land usually has a thick vegetation cover including forests with thick undergrowth. In most countries, the land is highly protected to prevent encroachment by humans. Many catchments have one or a couple of major rivers originating from them, these rivers are kept alive by the water available in the catchment hence by monitoring the river water parameter such as water level, inferences about the catchment can be made. In recent times, catchments have been heavily affected by climate change and catchment degradation.
To detect, monitor and quantify the effects of these threats to the well-being of the catchment, monitoring river water parameters such as water level and water turbidity is necessary. The result of the monitoring is data that can be used in diagnosing the catchment and in improving conservation efforts. The data can also be combined with other relevant datasets such as rainfall data in the catchment and satellite maps to predict future events in the catchments and catastrophes such as floods. At DSAIL we have developed, tested and deployed water level monitoring systems along the Muringato River in the Muringato watershed in Nyeri county, Kenya and also along River Ewaso-Nyiro North in the Ewaso Nyiro basin in Laikipia county, Kenya. We have also developed and deployed a water turbidity, water temperature, water electro-conductivity and water pH monitoring system along the Muringato River.
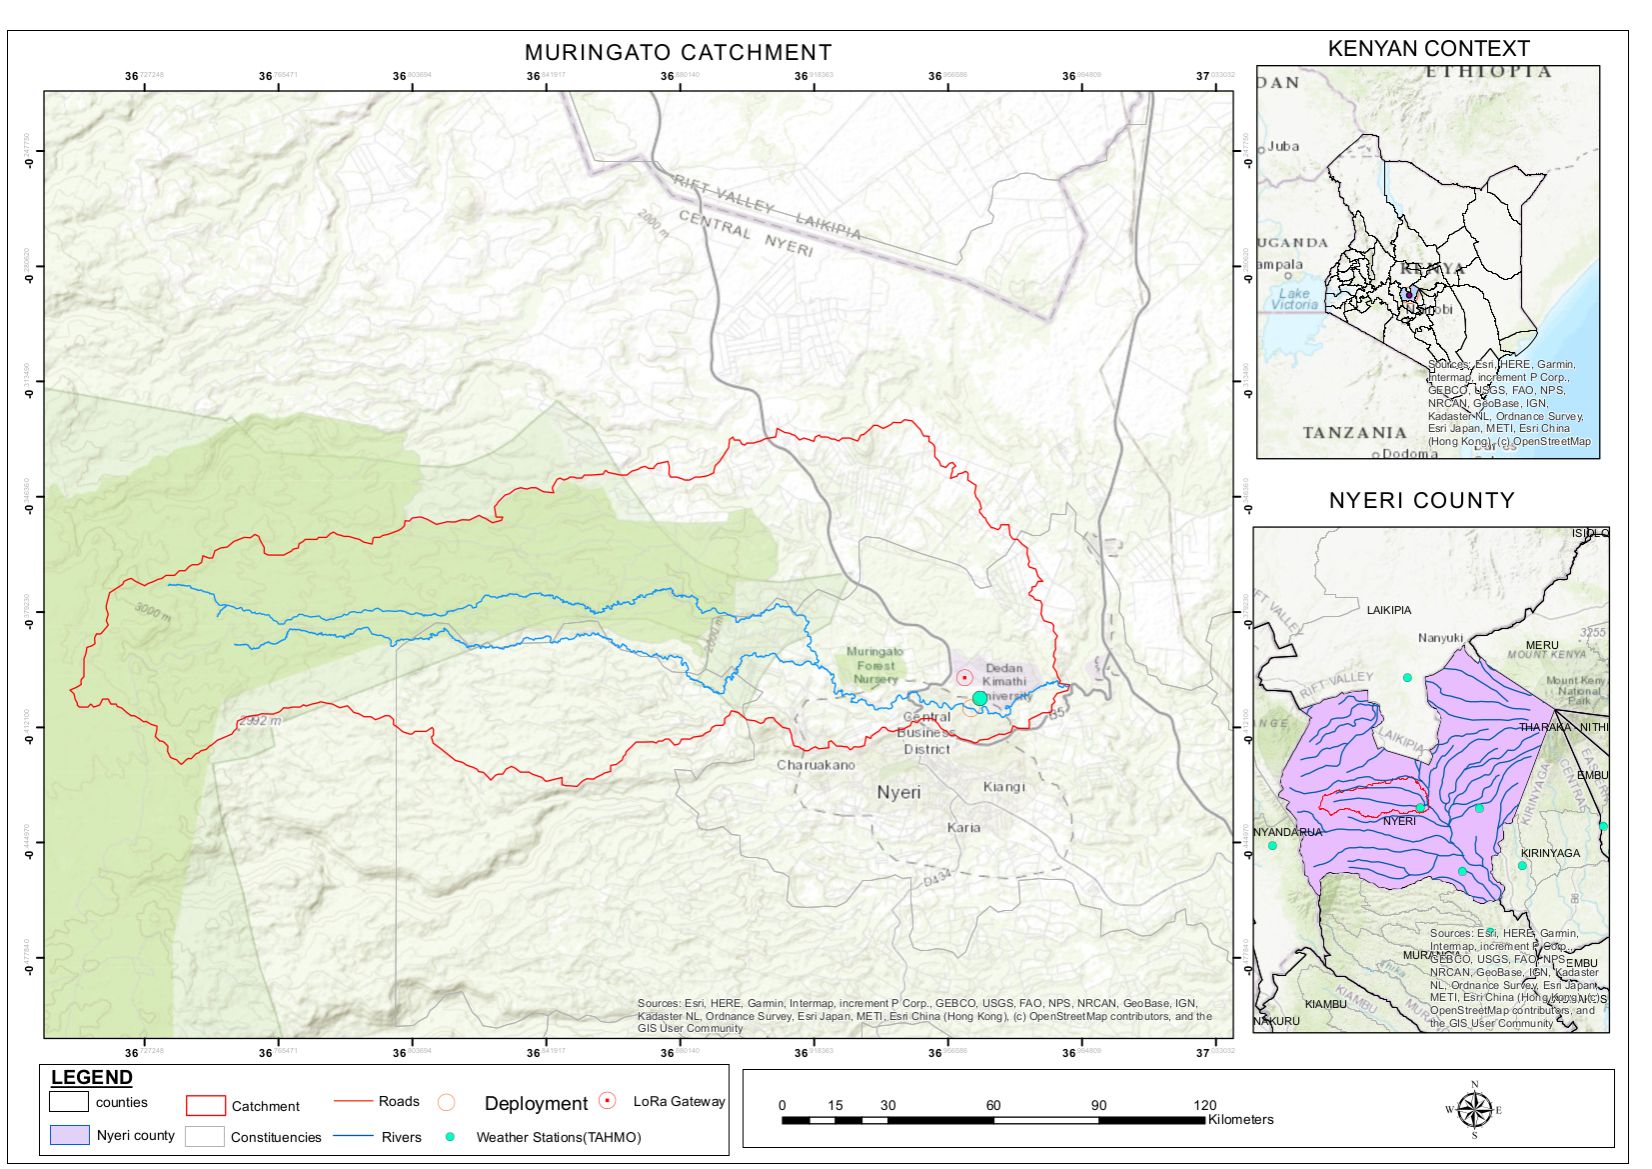
Muringato Catchment
The map below shows the extent of the Muringato catchment from the Aberdare Ranges in Kenya (Upper catchment) to the Lower catchment areas near Dedan Kimathi University of Technology.
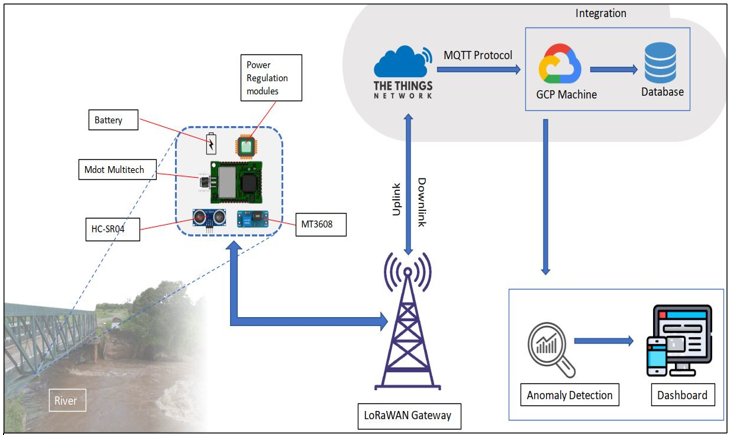
System Architecture
The system utilizes a LoRa network to transmit data from remote sensors to the gateway and cloud server for processing.
Next Steps
- Testing and analyzing anomaly detection algorithms to establish the best algorithms to detect anomalies in the data collected.
- Stage prediction using rainfall data from TAHMO (Trans African Hydro-Meteorological observatory)
- Publish the dataset
- Expansion of the deployments to cover other river sections
Links
- Jason Kabi website: https://kabi23.github.io
- DSAIL Github repo: https://github.com/DeKUT-DSAIL/ewaso
- Hardware files: https://data.mendeley.com/datasets/mszg723r9b/2
- Data visualisation app: https://water-monitoring-258811.wl.r.appspot.com
- Project Technical report: Technical Report PDF