Project Muringato at a Glance
Introduction
The main aim of Project Muringato was to carry out analysis of the Muringato sub-catchment by analyzing the interaction between some the catchment variables. Different catchment variables fall under different categories such as; landscape variables which include vegetation cover or human encroachment, hydrological variables such as river discharge or stage, climatic variables such as rainfall or temperature and finally geological variables such as type of soil available in the catchment area or the catchment gradient.
Since we had a source for the climatic data, we decided to collect data of at least one hydrological parameter. The parameter we settled on first was river water level (stage). This is because it was the easiest to monitor and we already had a plan and a picture of how to monitor it. The Muringato River is the main drainage system in the Muringato sub-catchment hence, its stage data can be used to draw well-being inferences about the catchment area. Over the years, many infrastructures such as staff gauges, bubble gauges and stream gauges have been develop to monitor stage along rivers. Despite being effective, these infrastructures are complex, bulky and expensive to build and maintain. Therefore, alternatives that can improve on the traditional instruments' drawbacks are needed. To monitor the river water level, we settled on an IoT infrastructure that is was fit deployment. Figure 1 is a block of infrastructure.
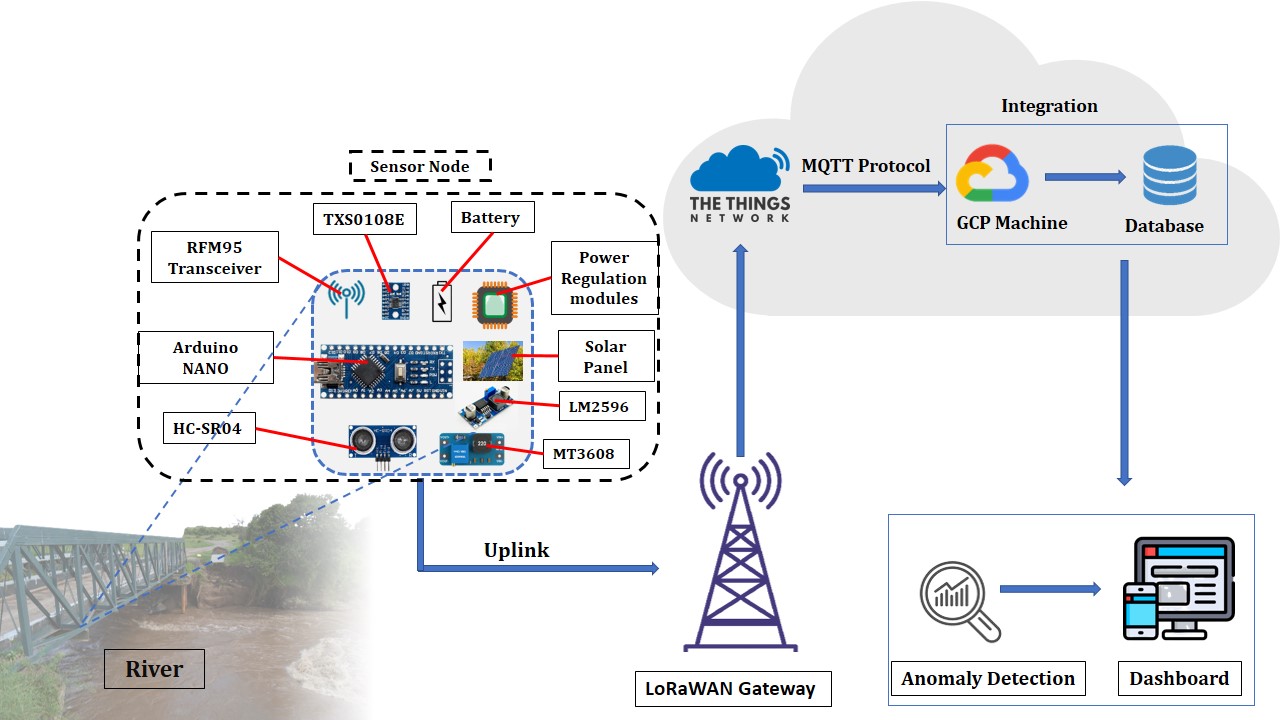
Figure 1: Project Muringato Block Diagram
Sensor Node Development
As shown on Figure 1, sensor nodes to collect the water level data along the river were needed. Two sensor node setups were developed. The first setup was based on the Multitech mDot and second setup was based on the Arduino Nano. The micro-controllers were utilizing a HC-SR04 ultrasonic sensor to collect the data and LoRaWAN transceiver to transmit the data to a network (The Things Stack - TTN). The sensor nodes developed were battery powered and solar panels were used to charge the connected battery sources. Power regulation and conditioning circuits were used to ensure the correct voltage levels and onboard power analysis sensors were used to keep track of the power levels available for the sensor nodes. Figure 2 shows a fully assembled Arduino Nano sensor node.
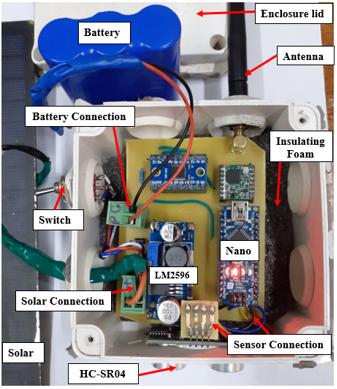
Figure 2: Fully assembled Arduino Nano Based Sensor Node
Sensor Node Test and Deployment
Before deployment the developed sensor nodes were subjects to a range test. The test was done to establish the measuring range of the ultrasonic element. All the sensor nodes were found to be working well and the measuring error was negligible. The longest range was 438cm. Since the depth of river channel at all deployment locations was less than 300cm, the sensor nodes were fit for deployment. The sensor nodes were deployed along River Muringato in the lower catchment area of the sub-catchment. Before deployment, reconnaissance visits aided in identifying suitable deployment locations. In total, 4 sensor nodes were deployed the river on permanent structures such as bridges and tree logs. Figure 3 shows a deployed sensor node.
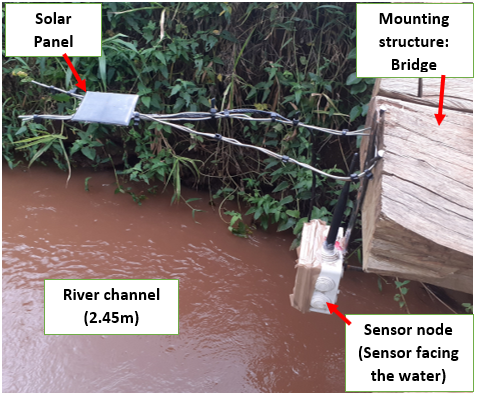
Figure 3: Deployed sensor node
The sensing elements, antenna and switch were external parts as shown on Figure 2. The sensor nodes were programmed to collect data samples after every 5 minutes. In a data collection instance, a sensor node would measure the distance from the ultrasonic element to the water surface using the sensor. To attain the water level value, this distance would be deducted from the distance between the sensing element and the channel bed.
Wireless Sensor Network (LoRaWAN)
As shown on Figure 1, the deployed sensor nodes were utilizing a LoRaWAN network to transmit data to the network server (The Things Stack). The network was established by deploying programed LoRa gateways at strategic locations near the gauging locations. The closest sensor node was 1km away from the deployed gateways. A network analysis was done to establish the network boundaries and also to establish the Received Signal Strength Index at different locations away from the gateway. Having a good RSSI score at the deployment location aided in lowering the packet loss. Figure 4 and 5 show the specifics of the gateways deployed.
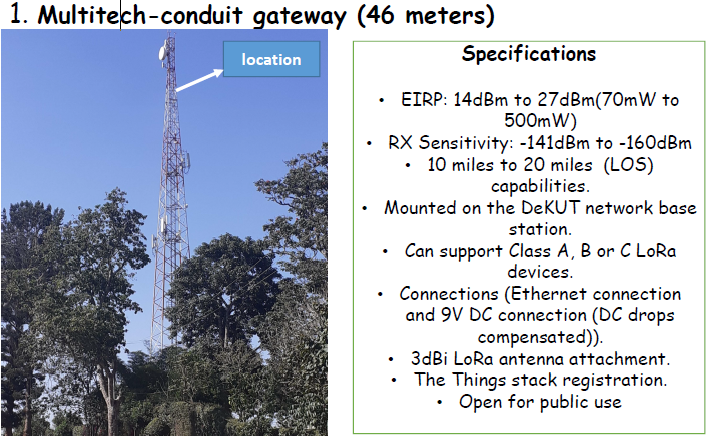
Figure 4: Multitech Conduit deployment location and Specifics (Dedan Kimathi University of Technology)
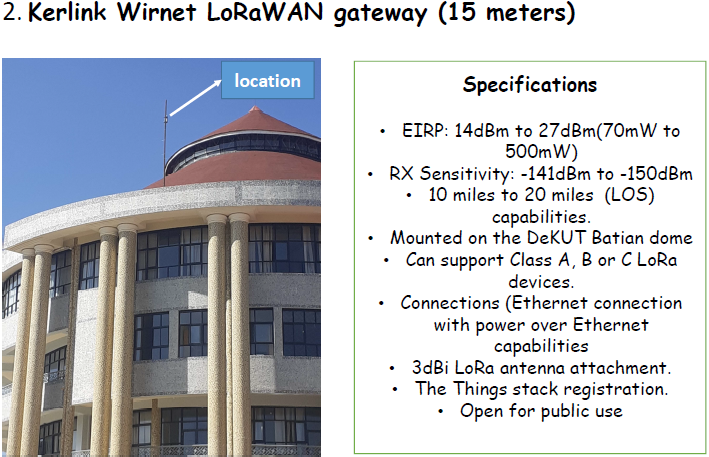
Figure 5: Kerlink Wirnet Station deployment location and Specifics (Dedan Kimathi University of Technology)
The network analysis was named Radio Mapping. Shown in Figure 6, is a map that represents the area covered by the established network in the Muringato catchment (yellow: deployment location, orange: Network test locations, Red: Gateway location). The deployed gateways were practically at the centre of the area covered by the established network. The gateways were strategically installed at different heights for maximum coverage. The radio mapping/coverage test began at areas closer to the gateways followed by areas further away as indicated by the test location marks on the map. The closest test location was 0.9 km away whereas the furthest was 7.29 km from the concentrators. As expected, the network strength at a particular point was inversely proportional to the distance from the gateway hence, the coverage at 7.29 km was weak compared to the coverage 1 km away.
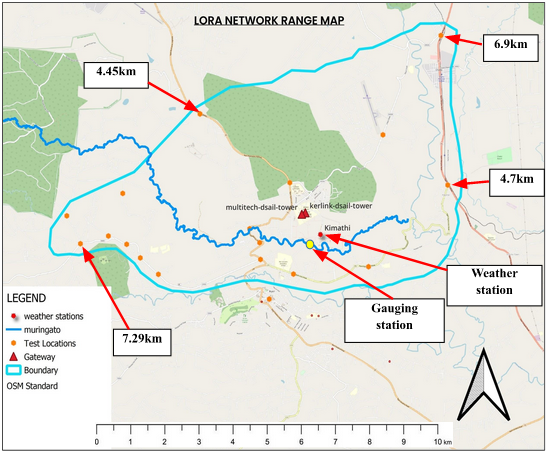
Figure 6: Network map (Gateways – Red Triangle) - (Boundary in Cyan) - (Deployment Location in Yellow)
Compared to the western section of the area covered by the established network, the eastern section was wider, this was brought about by the difference in terrain. As expected and desired, a significant section of the Muringato River was inside the network boundaries as indicated. The yellow mark on Figure 6 indicates one of the main deployment areas where two of the water level monitoring devices were deployed. The area was approximately 1 km away from the gateways and was in the Line of Sight (LOS) with one of the gateways (46 m high – Multitech Conduit) which in turn translated to strong network coverage of the area. Also shown in Figure 6, is a weather station (TAHMO station Kimathi). The time series rainfall data sets from this weather station and others in and around the Muringato sub-catchment were used in validating the water level data collected. The weather station was about 400 m away from the gauging location as shown.
Figure 7 is a map representing the entire Muringato sub-catchment/watershed under study in Nyeri county Kenya. The main components on the map are; the river Muringato in blue, the area covered by the established LoRaWAN network with respect to the entire catchment and also the sub-catchment size and boundaries in the Nyeri county context and the Kenyan context. With the River Muringato as the main drainage channel, the sub-catchment/watershed is part of the greater Tana basin in Kenya. The catchment also lies between two major water towers in Kenya, the Aberdare ranges and Mt Kenya in the central region. Water from these two towers support all major sectors of the economy from HEP generation to tourism and sustain a very rich and world-famous biodiversity.
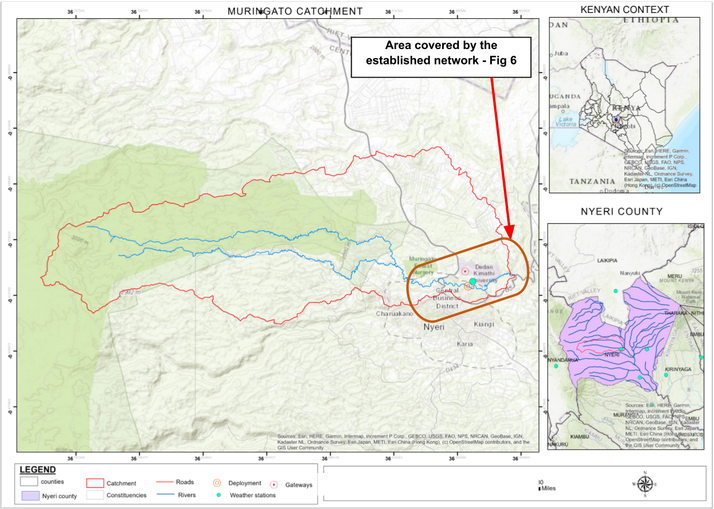
Figure 7: Muringato catchment (overview) (deployment/ gauging location in red corresponding to the point shown on Figure 6)
The sub-catchment covers a total area of 225km² and possesses the common characteristics of catchment areas as shown on Figure 7. The steep highlands to the west are covered by the Aberdare Forest which extends over the entire Aberdare ranges stretch. The forest is a highly protected resource and many of the tributaries that join to form the river under study originate here. The lower lying areas to the south-east are mostly under agriculture and settlement hence the river is a vital resource as it flows through these areas. The source of the Muringato (Aberdare Forest) is at an approximate elevation of 3000m above sea level (ASL). The ASL of the lower catchment as the river exits the watershed and drains into another major river is 1700m hence, the average river gradient across the sub-catchment is 1.23%. 45% of the watershed is forested and since the catchment is located in a tropical climate region, the weather conditions have been conducive for many agricultural practices but recently due to rising temperature, there has been significant change in weather patterns which have in turn affected the river Muringato and the well-known agricultural dominance. The annual precipitation average is 1600mm per annum. Having the gauging location in the lower catchment meant that the catchment effects on the water level would be captured before the exit. Also, the lower catchment area was suitable for the deployment since the water possesses low velocity (laminar flow) and the channels are shallow and wide.
The Network Server
The network server utilized was The Things Stack (The Things Network). All the gateways and sensor nodes and gateways and sensor nodes were registered on the network server to enable monitoring co-ordination. From the network server the data was being transferred to a permanent database on the Google Cloud Platform as shown on Figure 1.
The Water Level Data
The data collected was accurate but had to undergo pre-processing steps before being released. The pre-processing mostly involved Machine Learning based anomaly detection. The data was also used in multi-step time series forecasting. Validation being important in IoT, the data was validated by comparing it to other cause-datasets from the catchment area such as rainfall. Manual readings from staff gauges were also used in validation. Figure 8 shows a comparison between the water level data collected and the Rainfall data from a TAHMO weather station (Station Kimathi Figure 6) in the Muringato sub-catchment.
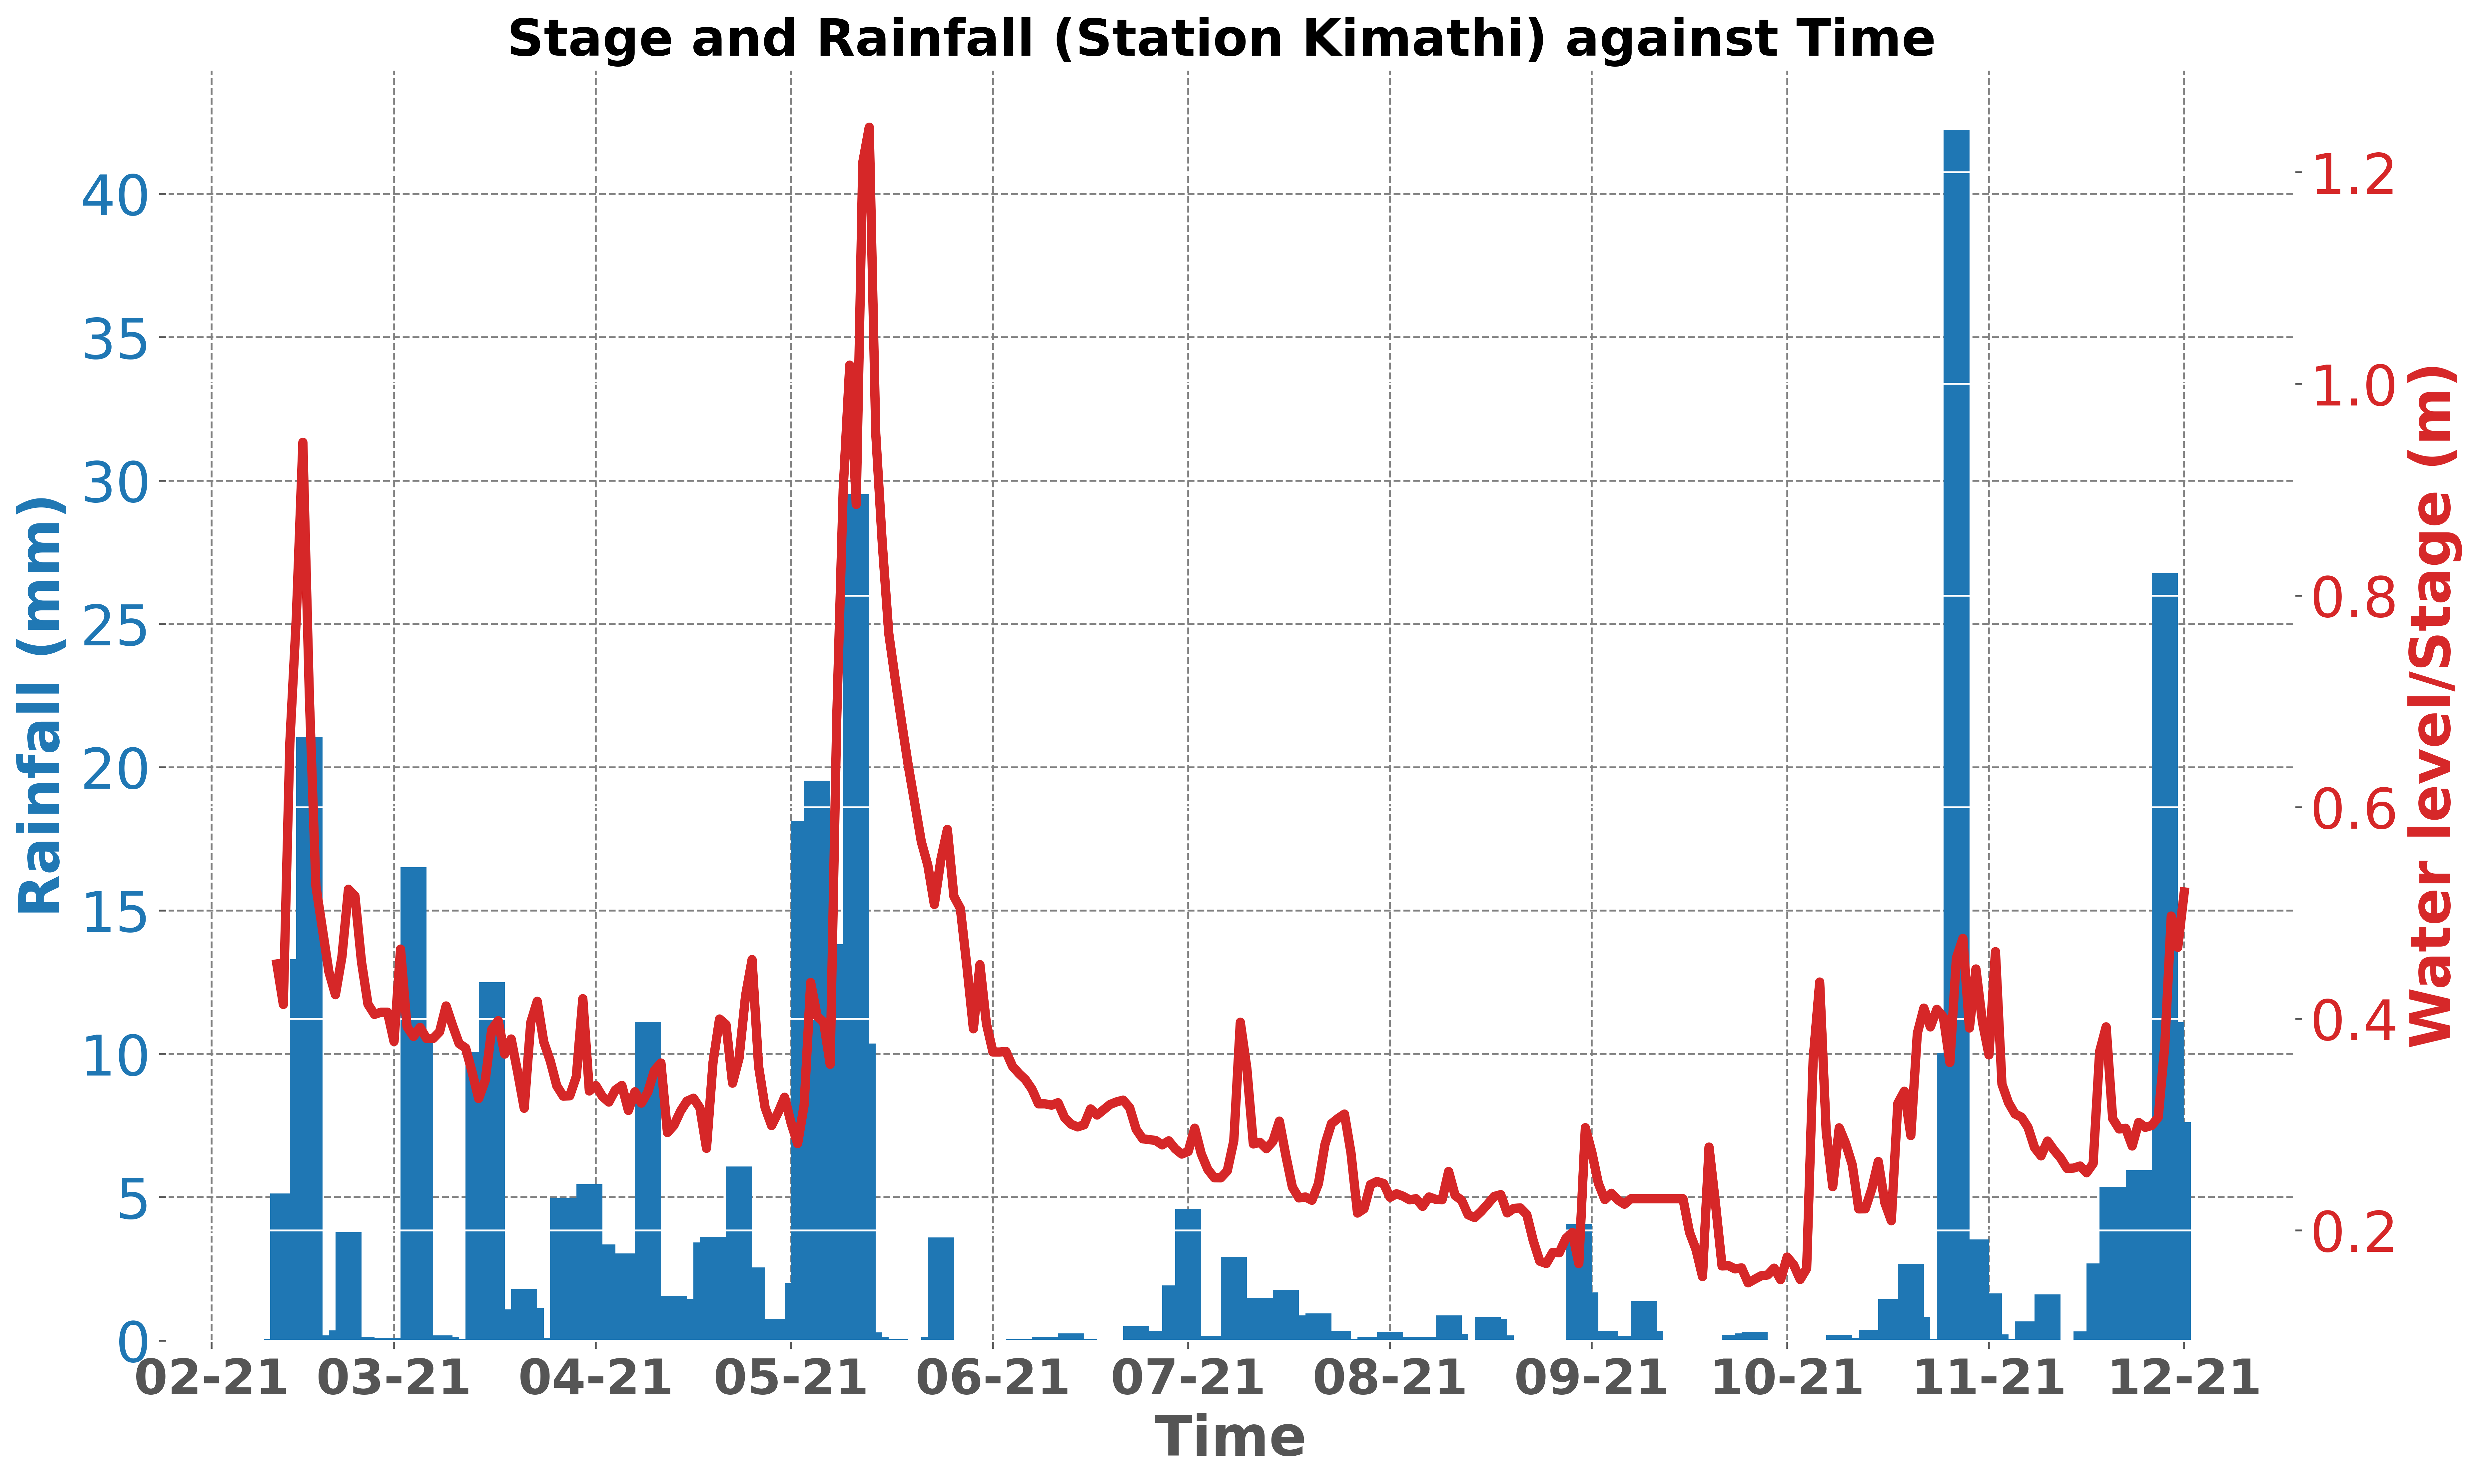
Figure 8: River Muringato water-level (2021) vs. rainfall (Kimathi Station) (2021)
Project Publications
Below are project publications which can enable a reader to understand the project further:
- [1] J. N. Kabi, C. Wa Maina, E. T. Mharakurwa, and S. W. Mathenge, "Low cost, LoRa based river water level data acquisition system," HardwareX, vol. 14, p. e00414, Jun. 2023, doi: 10.1016/j.ohx.2023.e00414. Available: http://dx.doi.org/10.1016/j.ohx.2023.e00414
- [2] J. N. Kabi, C. W. Maina and E. T. Mharakurwa, "Anomaly Detection in IoT Data," 2023 IST-Africa Conference (IST-Africa), Tshwane, South Africa, 2023, pp. 1-10, doi: 10.23919/IST-Africa60249.2023.10187760.
- [3] J. Kabi and C. Maina, "Leveraging IoT and Machine Learning for Improved Monitoring of Water Resources - A Case Study of the Upper Ewaso Nyiro River," 2021 IST-Africa Conference (IST-Africa), South Africa, South Africa, 2021, pp. 1-8.