Tutorial 4: Anomaly Detection in Time Series Data
Introduction
The success of all monitoring or data collection IoT practices is highly dependent on the proper operation of the sensor nodes deployed, specifically the sensing elements. In scenarios such as outdoor deployment, the desired operation is difficult to guarantee since the sensing elements are fragile and prone to damage which can in turn lead to a malfunction.
In Project Muringato, the deployed sensor elements were exposed to disturbing factors such as harsh weather and invasion by the insect population. This led to the presence of anomalous data points in the data collected and also raised the need of ensuring that high quality data output.
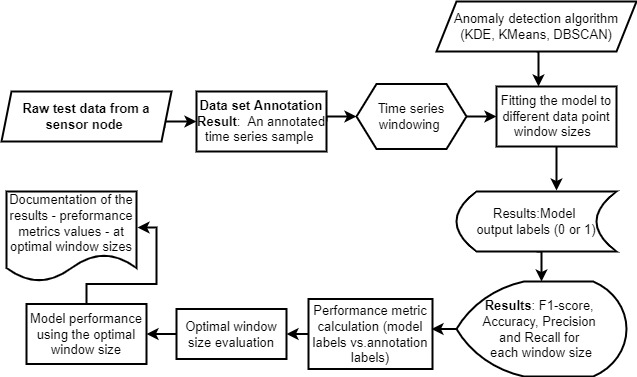
Since the sensor node produced large volumes of data, the detection of the anomalous data points could not be handled manually. Classical Machine learning outlier detection algorithms were employed in detecting the outliers in the data collected. To test the performance of the models considered, the models underwent a model evaluation test. The test was aimed at evaluating which model was best for the time series set collected based on the performances on the data extracts used in the test.

Figure 1: Model Evaluation Procedure
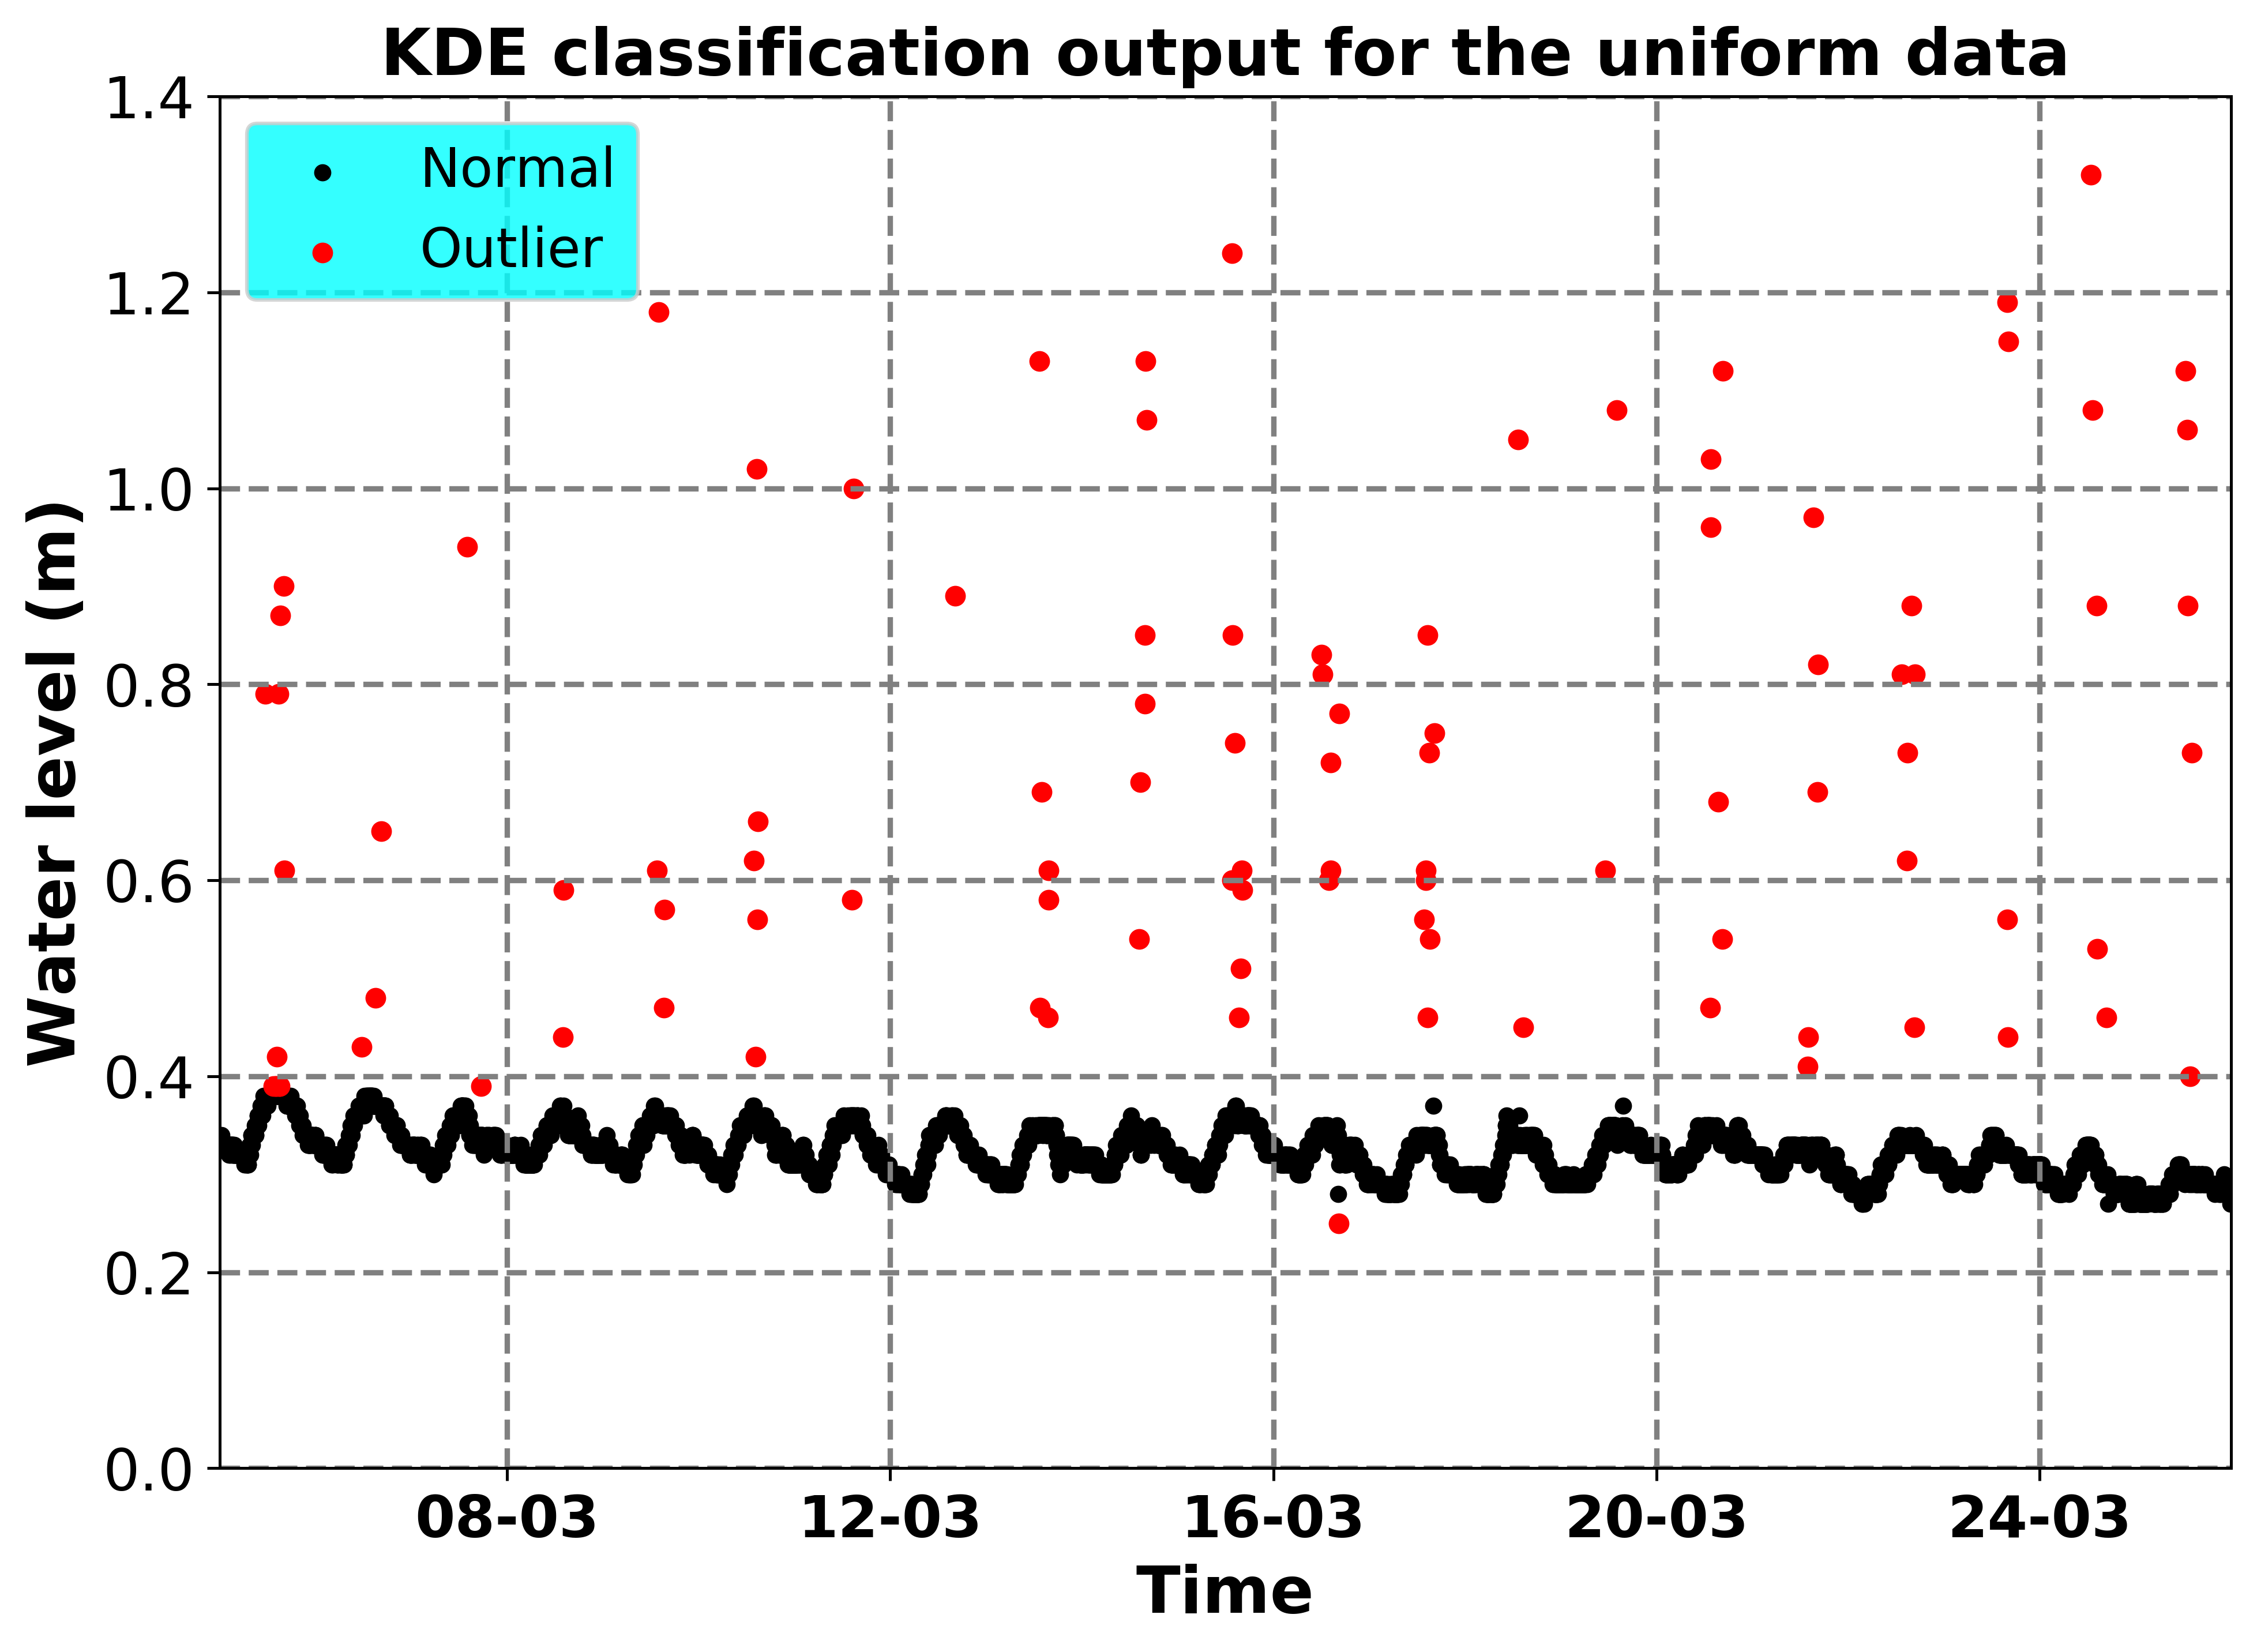
Figure 2 shows a section of data collected by a sensor node in Project Muringato from
06th March 2022 to 26th March 2022 (Total data samples: 5863, Outliers: 101, Normal: 5762).
The anomalies are in Red whereas the normal data points are in Black. As shown, the normal data
points were the majority. This indicated that the sensor node was working as expected.

Figure 2: Sample Data from a Project Muringato Sensor node
Anomaly Detection
In this tutorial section, we are going to evaluate the performance of
Kernel Density Estimation (KDE) as a method of outlier detection. The link below is
for the (Tutorial Exercise)
Notebook Access
Access the interactive tutorial notebook here: Google Colab Notebook